Happy Friday and happy payday! From Monday’s open to the low of the week on Tuesday, we saw a -4.5% price drop in ULTY 0.00%↑ — which was one of the biggest swings in quite some time. Did you buy the dip, hold, or sell?
The overall markets continue to drift higher and we also see Yieldmax is deep in active management mode, de-risking and refreshing the underlying basket. More volatility is likely coming soon, so build a game plan now and be prepared for anything.
Highlights, position changes, and data tables all below.
ULTY Highlights:
AUM: $2.2B
New inflows (est.): $25M
Cash balance: $119.5M
Options Premium (net): $3.1M
On watch:
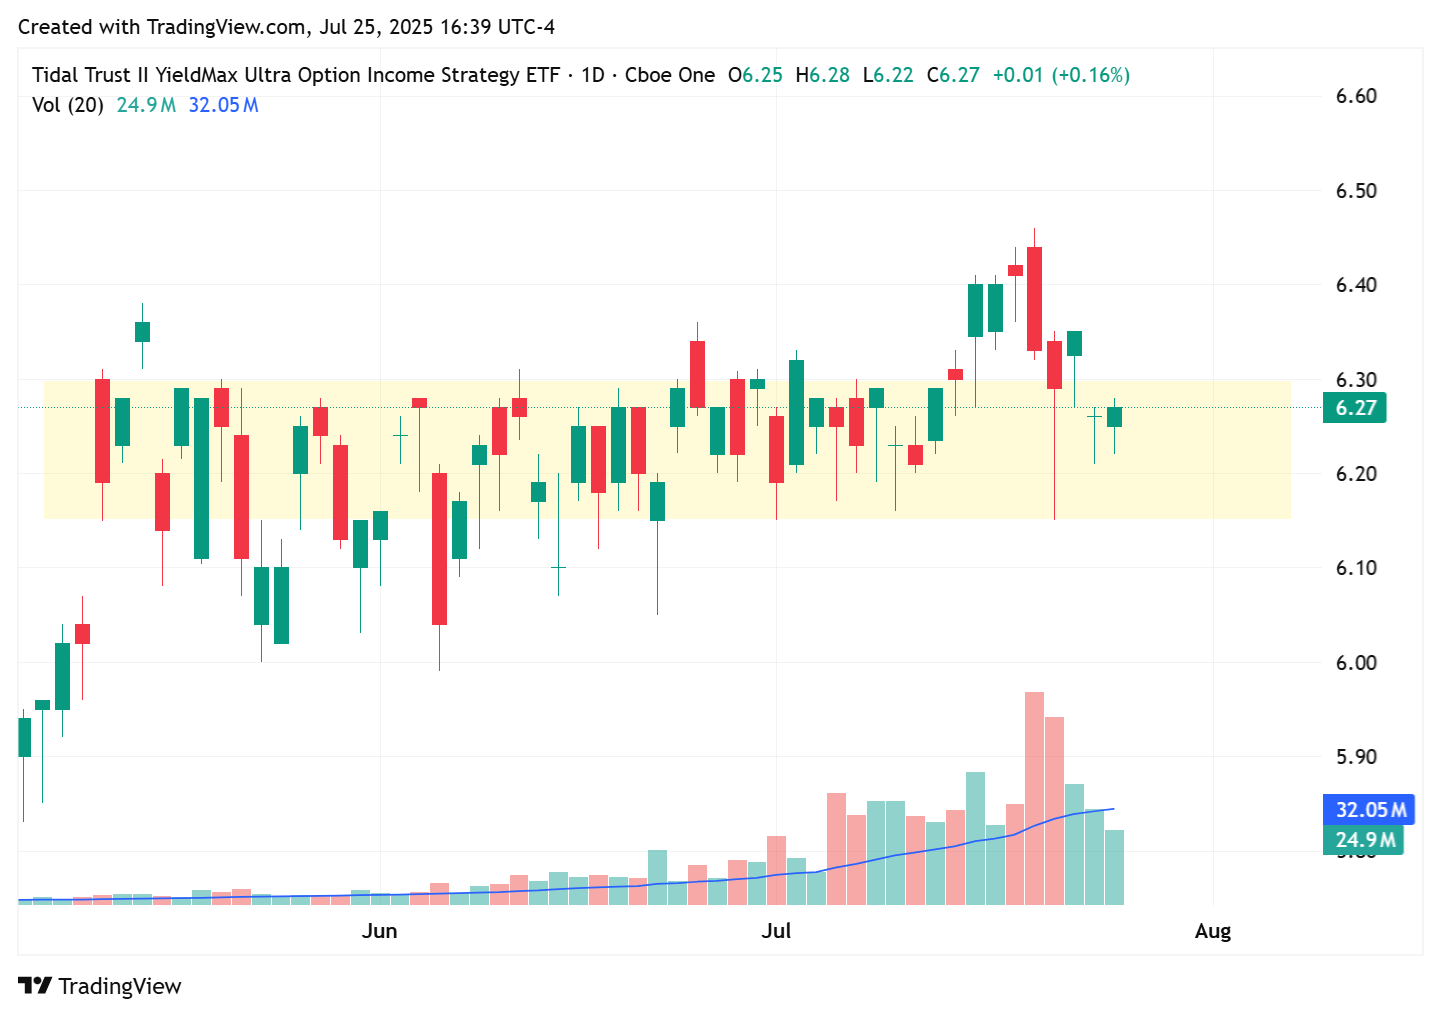
Decreasing volume: Today was the first day in 3 weeks where the daily volume traded below the 20 MA (see chart at bottom). This could signal the current wave of inflows is tapering off — this isn’t a bad thing per se, but let’s keep an eye on it.
Spotlight Analysis:
Note: Stock cashtags are real time — they won’t always match with the text
Position changes:
New positions: N/A
Closed positions: N/A
Top Holdings Changes (shares):
GLXY 0.00%↑ (+41%)
COIN 0.00%↑ (+17%)
Want deeper insights? Learn more about the new Growth Tracker:
Movers & Shakers (underlying performance):
Top winners today:
INOD 0.00%↑ (+6.2%)
VRT 0.00%↑ (+5.0%)
AAOI 0.00%↑ (+4.9%)
Biggest 3 losers today:
ASTS 0.00%↑ (-9.5%)
GLXY 0.00%↑ (-4.0%)
RGTI 0.00%↑ (-3.2%)
The Data & Charts:
View the full Google Sheets tracker here or the individual tables below.
On mobile? Tables may be cut-off — tap to open.
Daily Chart: ULTY 0.00%↑
We can see the price range is back inside the “golden pocket” (between $6.30 and $6.15). This 2.5% performance range is a stable channel and provides good levels for those managing risk.
Also note that today’s volume is now below the 20D moving average (blue line). We’ll see how next week shapes up and if we return of June levels of volume (nothing to be worried about yet).


