💎 ULTY Underlying Stock Performance Tracker
Performance comparison of the underlying stocks vs ULTY
The ULTY Underlying Stock Performance Tracker displays the aggregate performance of ULTY 0.00%↑ holdings. These holdings (of 20+ stocks) are often 90% weight within the fund. This tracker analyses the weighted and normalized performance of the underlying basket which can heavily influence the day-to-day performance of ULTY. It provides an efficient way to track trends vs. tracking 20 different individual stocks.
It is extra content available for paid subscribers.
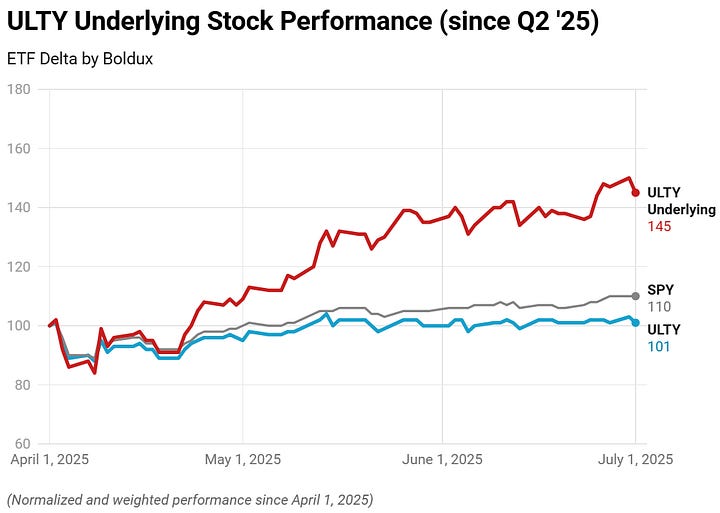
Sample data: As of July 1st, the underlying basket of stocks was up 45% since April 1st while ULTY 0.00%↑ was up 1% (not accounting for total return). As a reference, SPY was up 10% during that same time period.


ULTY Underlying Stock’s Performance Tracker
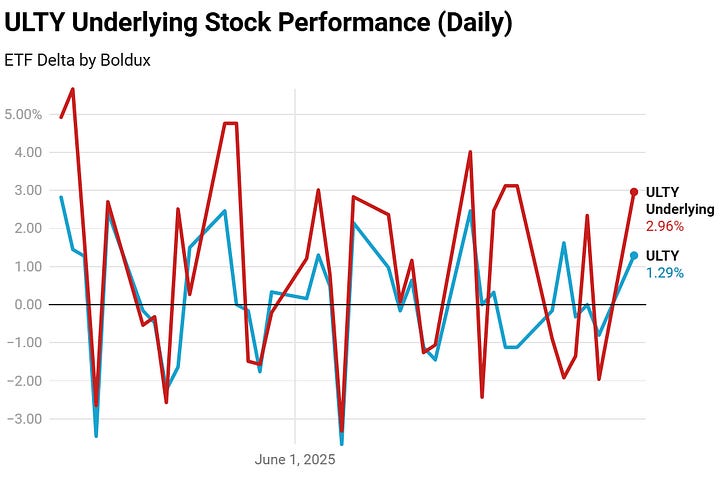
Timeseries charts for ULTY and the underlying stock performance are displayed below for paid subscribers.
Data is normalized to April 1st for the aggregate stock performance and starts May 12th for the daily chart. Charts are updated within 24-36 hours.


